Although the big football of the week has undoubtedly been the PR resignation of FIFA President Sepp Blatter, who has announced that he’s standing down but not for at least six months and not without continuing to make noises about pushing through “reforms” of the organisation that will place even more power into the hands of its executive, it’s not gone unnoticed here, or in the media, that on Tuesday the Barclays Premier League released the figures for this season’s payments to top flight clubs from its TV rights deals, figures that the Premier League “helpfully” put out as a graphic – if you just want to put them up on Twitter – but which is equally a right pain in the arse if you want to do any kind of analysis of the figures yourself.
So here’s the Premier League’s table of figures:
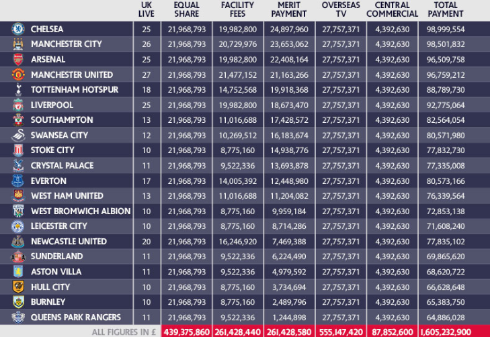
And with these figures we’re offered the assurance that with a ratio of just 1.53:1 in the difference between payments made to the top and bottom earners in the league, this is the “most equitable” distribution of TV rights money of any of Europe’s major football leagues.
That is perfectly true.
The Premier League certainly offers its smaller clubs a much better deal that Spain’s LA Liga where, in 2013-14, the Big Two (Real Madrid and Barcelona) each pocketed €140 million compared to just €18 million that went to the clubs finishing at the bottom of the division and where even teams that most people would consider to be major clubs in the league, like Valencia (€48 million) and Athletico Madrid (€42 million) received only around a third of amount paid to the league’s two giants.
Looking at the figures for the other major European domestic leagues for 2013-14 shows similar disparities in payments to the top and bottom clubs, albeit not quite on the scale that exists in Spain.
In the German Bundesliga the top two clubs at the end if that season, Bayern Munich and Borussia Dortmund, pocketed €36.9 million and €35.5 million respectively while the bottom club, Eintract Braunschweig received €18.2 million. In Italy’s Serie A, Juventus came away from that season with €94 million compared to just €17.9 million that went to the bottom club, Sassuolo and in France the Ligue 1 champions, Paris St. Germain, pulled in €44.6 million against just €13.1 million that went to bottom club Ajaccio.
That said – and in the interests of keeping things properly in perspective – the team that finished bottom the Premier League in 2013-14, Cardiff City, received €74.5 million in income from the Premier League’s TV rights deal, more than any team in either Germany or France and more than any of the teams in Spain and Italy other than Real Madrid, Barcelona, Juventus, Inter Milan and AC Milan* and this season’s bottom club, QPR, picked up the equivalent of €88.17 million, which is only around €2 million less than Juventus picked up last season for winning Serie A by 17 points over the second placed team, Roma.
*Note: This doesn’t include payments for participating in European competitions such as the UEFA Champions League and Europa League.
On the face of it, the Premier League’s smaller, less successful, teams get a much better and more equitable deal in terms of the distribution of income from their domestic league’s TV rights than their counterparts in any of the other four major European domestic league, but does that necessarily mean that they are getting a fair deal?
That’s a little more open to question.
To see why I’m posing that question we first need to understand how the Premier League’s TV rights payments to clubs are structured. The Premier League has three main sources of income:
– Domestic broadcast rights, which includes deals with Sky Sports and BT Sport for live TV games, highlights deals with the BBC for Match of the Day and MOTD2 and with News UK for its online highlights and radio coverage deals with BBC Radio 5 Live, Talksport and Absolute Radio.
– Overseas broadcast rights, which includes deals with a variety of broadcasters for coverage of live games and highlights outside the UK.
– Central Commercial, which includes promotional deals with Carlsberg and Nike and licensing deals with EA Sports for its FIFA series of games and Topps, who produce licensed trading cards.
The clubs’ share of the League’s revenues from overseas broadcast rights (£555.1 million in 2014/15) and Central Commercial (£87.8 million in 2014/15) is divided equally between the 20 clubs that played in the League this season, with each club receiving £27.75 million from the overseas broadcast rights pot and just under £4.4 million from Central Commercial.
The revenue from domestic broadcast rights is divided up somewhat differently.
Officially-speaking 50% of that revenue (£439.37 million in 2014/15) goes into a central pot which is divided equally between the 20 clubs, so each received a guaranteed payment of £21.97 million for the season.
25% goes to what the Premier League call a “merit payment”, i.e. prize money based on a team’s final league position for which they receive a little over £1.24 million per position. So QPR, who finished bottom of the league received just £1.24 million in prize money while this season’s champions, Chelsea, received just under £24.9 million.
The final 25% of the domestic rights pot is paid out to clubs as a “Facility Fee” which is based on the number of times they feature in live broadcast games on either Sky or BT Sport during the season. This Facility Fee is paid to both the home and away teams, even though it is only the home team that actually provides any actual tangible facilities and each team is guaranteed a payment of £8.775 million for the season to cover 10 live games, irrespective of the number of live games in which they actually feature, plus an additional payment of £747,000 per game for ever live game they feature in above the 10 covered by the minimum payment.
So within this system, individual clubs have two ways of increasing their revenues for the season relative to their rivals.
One way is to have a successful season and increase their prize money by finishing as high up the league as possible – and whatever you might think of the sums of money involved the basic principle of rewarding success is one that few people would consider to be unfair or unjustified.
The second way is by appearing in as many live games as possible in order to increase the amount the club receives by way of Facility Fees, but that’s a matter over which clubs have very little control.
The broadcast schedules are determined in part by the manner in which the Premier League auctions off its broadcast rights; when the rights for last season were auctioned seven packages covering a total of 154 games from the 380 played in a full season, each giving the successful bidder the right to broadcast a set number of game in a specific, exclusive, time-slot with BT Sport capturing two packages for a total of 38 games (28 on Saturday lunchtime plus 10 Bank Holiday/Midweek games) with Sky picking up the other five and the rights to broadcast games on Saturday evening, up to three slot on Sunday and Monday evenings (except Bank Holidays).
The packages also determine the order and in which the successful bidder get to choose which games they want to cover live from those scheduled for any of the 38 weeks of the season. Each package comes with the rights to a set number of 1st, 2nd, 3rd, 4th and (in a couple of cases) 5th pick games – yes, it genuinely is all a bit “jumpers for goalposts” – so the final decision on which games get covered on any given week is down to the broadcasters and to a certain amount of horse-trading between them and the Premier League once the full list of fixtures for the upcoming season is published, give or take any additional constraints that might come into play due to clubs being involved in European games or the occasional intervention on public safety grounds from a local police force.
What this means, in the first instance, is that although clubs are guaranteed payments for a minimum of 10 live games per season – and at a higher rate per game ($877,516) for those first 10 than for any additional live games above that figure – there is no guarantee in the deal that any individual club will actually feature in a minimum of 10 live games a season. It could be more – in some cases a lot more – but it could actually be less.
Now that obviously has one very direct implication for clubs; the more often they’re on TV the more they earn in facilities fees and the difference over a season can be pretty significant. This season’s top earner from live TV appearance, which inevitably turned out to Manchester United, pocketed £21.47 million in Facility Fees from 27 live games while there five clubs – Burnley, Hull City, Leicester City, Stoke City and West Bromwich Albion – we received only the minimum payment £8.77 million for 10 live games and, in all, 10 clubs – the five who got the minimum payment plus Aston Villa, Crystal Palace, Queens Park Rangers, Swansea City and Sunderland – received under half the total amount in Facility Fees that was paid to Manchester United.
However, variations in the number of televised live games that a club is selected for over the course of a season can also have a number of less obvious but still potentially very important implications, especially for the league’s smaller clubs.
Where do clubs generate their income?
Well, obviously for most clubs in the Premier League, the TV rights deal is their biggest source of income but beyond that there are revenues from ticket sales for home fixtures, albeit that for most clubs there is clear and finite limit to how much they can earn based on the capacity of their ground and local economic conditions, which dictate how much they can feasibly charge their main fan base for season tickets, etc.
Some clubs are certainly capable of generating significant sums from a bit of wheeling and dealing in the transfer market but that’s anything but a guaranteed income stream and even for relatively big clubs it comes with profound risks; selling your best players may bring in money in the short-term but those gains will rapidly evaporate if it has an adverse on the club’s performance and, like Liverpool this season, it misses out qualifying for the Champions League or, worse still, if it leads to the club being relegated to the Championship.
Then there are other commercial activities that clubs can and do engage in to generate additional income; everything from ground and shirt sponsorship deals to deals with kit manufacturers and the sale of replica kits and other merchandise right the way through to pitch-side advertising.
And, I suppose, finally there is also the option of selling the club to a new owner who’ll bring in extra money of their own in the hope of improving the team’s performance and increasing the clubs income from all its other sources.
In order for a club to maximise and, over time, even increase it’s off-field commercial revenues it needs to increase both its public and its commercial profile beyond its core local fan base and in this day and age that means gaining the maximum TV exposure possible by being featured in as many televised live games as possible.
The more TV time a club gets the more attractive it will be to sponsors, advertisers, kit manufacturers and even investors and the better it’s negotiating position will be when dealing with those parties.
The more TV time a club gets, the more chance it has of developing a significant fan base outside its traditional local catchment area, which can mean anything from increased sales of replica kits and other merchandise to the possibility of the club participating in potentially lucrative pre-season games, tours and mini-tournaments.
And the key to maximising your TV time, even in overseas markets, is the Premier League’s domestic TV deals with Sky and BT Sport. Yes, the revenues from the League’s overseas broadcast deals are shared equally between the clubs but in terms of TV exposure overseas, which is what clubs need to build up their commercial revenues, it’s much better for a club to be chosen domestically for a live game, which ensures that its game is the only live Premiership game in a particular time slot, than it is to be playing at 3pm on Saturday afternoon and competing for the attentions of overseas broadcasters and viewer with, for most of the season, anything from four to six other Premier League games.
The number of live games that a club is chosen to feature in over the course of a season matters, and it matters for reasons which stretch beyond merely those of the extra direct revenue it gains from Facility Fees.
So, bearing all that in mind, how did this season’s TV deal pan out for the clubs?
Well, perhaps the first thing to note is that the Premier League’s 50:25:25 split between it’s “equal share” payment, the facility fees and the prize money didn’t actually pan out at those exact figures.
The £439.37 million that was shared equally between the 20 clubs isn’t actually 50% of the TV money, it’s only 45.8% of the total pot of £962.23 million, leaving £522.85 million (54.3%) to be split almost evenly – give or take £140 – between the facility fees and prize money pots, each of which got just under £261.43 million (27.1%) of the total pot.
So, contrary to the impression the Premier League would no doubt like to create, the split on domestic TV revenues was actually loaded in favour of those areas – the facility fees and prize money – where the money wasn’t going to be distributed evenly between all 20 clubs and not by a small amount either. The difference between splitting 45.8% of the total pot equally between the 20 clubs and splitting half the money between them is a total of £41.7 million or slightly over £2 million per club. That may be loose change to the Manchester clubs, where it might just about cover the wages of a minor squad player but to a newly promoted team like Burnley that’s a full season’s wages for maybe 2-4 players who came up with the team or first year’s wages for what would be, by their standards, a fairly major signing.
The prize money is what it is, of course, but when it comes to the facility fees the figures provided by the Premier League tell us how many live games clubs were paid for but not, necessarily, how many live games actually featured some of those clubs, in particular those that received only the minimum payment.
So, in addition to extracting all the figures from the payment table, I’ve also been through the full list of televised games to see exactly how many games featured each club and knocked up a quick chart of the results:
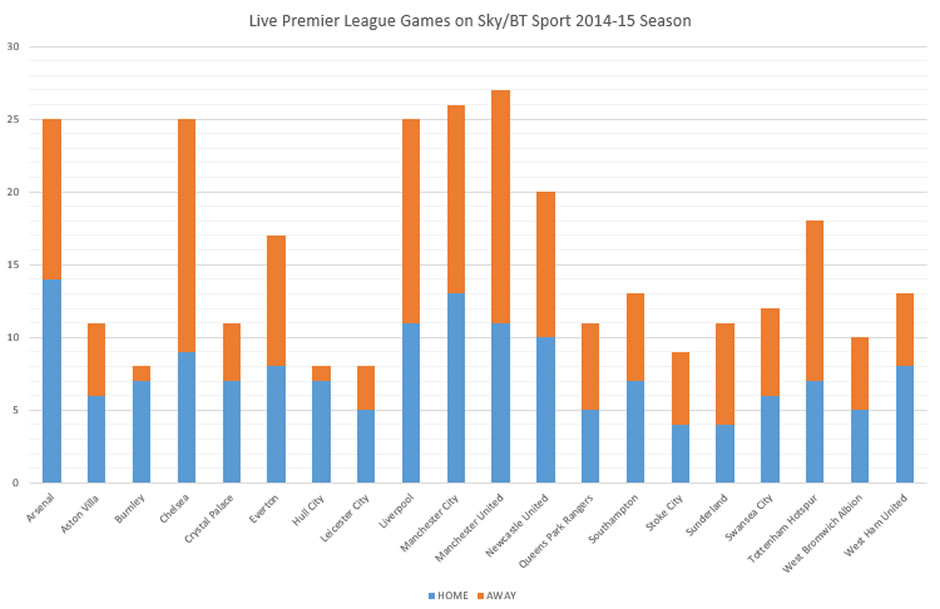
As you might well expect, the teams that featured most often in live games over the course of the season and, consequently, took the largest slice of the facility fees pot were what I suppose you could call the ‘Big Five’, Manchester United, Manchester City, Arsenal, Chelsea and Liverpool. These are the five richest clubs in England and, based on the previous season’s revenues, five of the ten richest clubs in world football and they are also almost certainly the five English clubs with the largest global fan base. For broadcasters like Sky and BT Sport, these are the clubs that will generate the largest number of subscriptions and the best viewing figures, which means the highest adverting revenues, so it’s no surprise that they’re the go-to teams when it comes to choosing which live games to cover nor should it come as any great surprise to find that every single game between two of these five teams was featured live on either Sky or BT Sport.
At the other end of the scale, of the five team who received the minimum 10 game payment only one, West Bromwich Albion, actually featured in 10 live games. Burnley and Leicester City, two of the three new teams promoted to the Premier League this season, featured in just 8 live games as did Hull City, while Stoke City were afforded just 9 live appearances all season.
Again, I’m not sure that’s necessarily particularly surprising,
Burnley and Leicester were expected to go down and their overall form of both for most of these season, until Leicester started their successful push for survival, tended to vindicate that view.
West Bromwich Albion had a terrible season in 2013/14 and the appointment of Alan Irvine as head coach during the close season was hardly the most inspiring move of the summer and Stoke just have a reputation as a dour team from Tony Pulis’ time as manager that they’ve yet to shake off even if their actual performances this season suggest that reputation is now rather undeserved.
That leaves us with Hull City, who had a pretty decent first season in the Premier League in 2013/14 and had laid out some fairly big money on new players over the close season, so they might have started out expecting at least a little bit more interest from the broadcasters but then over the course of the season their team didn’t really deliver and although they were featured twice in live games in May, when there’s at least some broadcast interest in teams fighting against relegation, so it perhaps in part down to their overall form over the season that they failed to generate much interest.
Of course, the one other thing that these clubs obviously have in common is that they are all ‘family clubs’, which is the standard euphemism in football for teams that have draw the vast bulk of their support from the local area, where team loyalties literally run in the family, but otherwise have a very limited appeal outside their core catchment area, and I say that, in all honesty, as a fifth generation West Brom fan who’s under no illusions about the club – we know who we are!
Overall, what the bar chart is telling us is that, in the eyes of the broadcasters, there are three distinct tiers of club in the Premier League. There are the five premium clubs each of which had well over half of their games broadcast live; a small middle tier, which currently consists of just three clubs – Spurs, Newcastle and Everton – that had about half their games broadcast live, and then there’s the rest, the most popular of which with the broadcasters were Southampton and West Ham who were both featured in live games on 13 occasions.
Within that structure there are one or two fairly interesting patterns that are worth noting and commenting on.
Of the three promoted team, the only one to exceed the 10 games for which all club were at least paid was QPR, which got one live extra game – and three more than either Burnley or Leicester – and from a detailed table I put together showing which games were shown live and when (by month) at least part of the reason for that lies with the fact that, as a London-based, QPR notionally had 10 local derbies with other London sides to pique the interest of broadcasters, something the other newly promoted teams lacked*.
*Sorry, Burnley fans, but your club’s been outside the top flight for far too long to count the two Manchester and the two Liverpool clubs as local rivals.
It also certainly appears that West Ham also benefited, in terms of generating interest from the broadcasters, from being a London club as, to a lesser degree, did Crystal Palace although it difference between the two – 13 live games against 11 – may well come down to nothing more than West Ham showing much better early season form as it does also look very much as if Southampton (13 games) and Swansea (12 games) picked one or two extra live appearances on the back of having, by their standards, very successful seasons.
Of the five premium clubs, easily the most interesting in terms of their pattern of live games over the season is that of the league champions, Chelsea. Despite topping the league for almost the entire season, all bar the very first week, Chelsea lagged behind the other four premium clubs – Arsenal, Liverpool, Manchester City and Manchester United – in terms of their number of televised live games for the vast majority of the season. At the halfway point in the season, at the end of December, Chelsea had been featured in a live game on just 11 occasions, three fewer than both Liverpool, who were 10th in the table, and Manchester United, who were 3rd but still 10 point behind the leaders. By the end of March, Chelsea had featured in 16 live games, Liverpool’s total stood at 21 games, one ahead of Manchester United on 20 games, and it was only over the last two months of the season, which nine of Chelsea’s last ten games were televised live, that they caught up with Liverpool and Arsenal, if not quite with either of the Manchester clubs.
Now that could be a remarkable piece of prescience on the part of the broadcasters, holding back a bit on featuring Chelsea early in the season compared to the teams that were expected to be their main rivals to leave room at the end of the season to cover their final run to the title live and almost in its entirety, or it could be telling us simply that Chelsea are the least bankable team of the big five, at least when they’re not a nailed on certainty to win the title.
And to go with that there’s also the fact that of the 25 Chelsea games shown live during the season, 16 were away from home, the joint largest number of away games of any club with Manchester United and the largest proportion of away games (64%) of any of the 20 clubs.
Does that point to an issue with the broadcast facilities at Stamford Bridge, something about the set up there that live broadcasters dislike, or could it be Chelsea’s home form under Jose Mourinho – one defeat in a little over five seasons – that they find off-putting.
Could it be that games in which the result is expected to be a bit of a foregone conclusion are bad for pulling in the viewers?
That could explain the broadcaster’s apparent preference for Chelsea’s away fixtures over their home games and it would also fit well with the fact that both Burnley and Hull were featured in live games only once each when playing away from home and in neither game were they playing one of the premium clubs. Burnley’s televised away game was their 4-0 defeat at West Brom, Hull’s was a 3-0 defeat at West Ham; and with the fact that the only other team not to have an away game against one of the big five televised live was Leicester City, who lost four of those games but did at least managed a creditable and – from what I recall – rather entertaining 2-2 draw on their visit to Anfield.
Having said all that, there is a certain inevitability about the fact that if you give the live broadcasters the latitude to pick and choose which matches they broadcast, even if its not an entirely free choice, then the richest, best supported and most bankable teams in the league will be featured in live games more frequently than the smaller, less popular team and that if you run a system under which clubs received what is in effect an appearance fee for each live game then those rich, popular, well-supported clubs will end up with the lion’s share of the money. Of the £261.4 million that went into the facility fees pot this season £102.1 million (39.1%) went to the big five clubs and if you add in the payments to three mid-tier clubs, Everton, Newcastle and Spurs, then just eight out of the twenty clubs took £147.1 million (56.4%) from the pot leaving £114.3 million (44.6%) to be shared by the other 12 teams.
It’s not difficult to see why the live broadcasters chose to broadcast 27 of Manchester United’s games, or 26 of Manchester City’s or 25 games each from the schedules of Arsenal, Liverpool and Chelsea and I can also see why they pick 18 of Spur’s games and even 17 of Everton’s – and that’s allowing for the fact that the club had, by their recent standards, a pretty poor season.
But what I really can’t see, being brutally honest, is why Newcastle got 20 televised live games, and a payout of £16.2 million.
But surely Newcastle are a big club, aren’t they?
Are they really?
Yes, they currently have the fourth largest stadium in the Premier League behind Old Trafford, the Emirates and the City of Manchester/Etihad, although they’ll drop back to fifth when West Ham move into the Olympic Stadium in 2016/17 and down to seventh by the time Spurs finish the replacement for White Hart Lane and Liverpool finally get around to refurbishing and extending Anfield.
And yes, they rarely if ever have any difficulty in filling their stadium close to its capacity of 52,405.
And yes, their fans are certainly passionate, often to the point of outright derangement.
But then, Newcastle is also one of the largest towns/cities in England to have only one professional football team, if not potentially the largest if you take into account the club’s entire uncontested local catchment area.
On paper – and if you think only in terms of Newcastle-upon-Tyne itself – then there are several towns and cities in England that have a bigger population and just one local professional football club. Leeds is the largest in terms of population, followed by Bradford – although there were two professional teams in the city up until 1970, when Bradford Park Avenue dropped out of the Football League before going bankrupt in 1974. After that there’s Leicester, Coventry and Doncaster and then we get to Newcastle, which sits just above Bolton, Sunderland and Brighton.
But that relies on defining the catchment area for the club’s local fan base just to the city area of Newcastle to the North of the River Tyne, which means excluding Gateshead on the South-side of the River, whose population would push that of the club’s potential catchment area above everywhere else other than Leeds and Bradford, and even that seems likely to be a major underestimate once you add in County Durham and Northumberland as part of “Toon Country”. Now we’re looking at a club with a local catchment area that has a population bigger than Leeds and probably bigger even than local areas contested by the two Manchester or the two Liverpool clubs.
That’s great for filling your home stadium of a Saturday afternoon but it doesn’t make you a big club, not on the level of a Manchester United or an Arsenal and maybe not even on the level of a team like Spurs or Everton, given their recent successes because we’re also talking here about a club that hasn’t won a domestic trophy since 1955. A club that has a recent track record in Premier League which is somewhat patchy at best and one that, this season, had one good run of form that it failed to sustain and then fell away so badly that the club got pulled into a relegation battle which it escaped from only on the very last game of the season.
To illustrate my point I’ve knocked up another couple of graphs for you to look at, the first of which looks at Newcastle’s overall performance as a Premier League club since 1992 in comparison to three other clubs with comparable records over the same period; Aston Villa, Everton and Spurs.
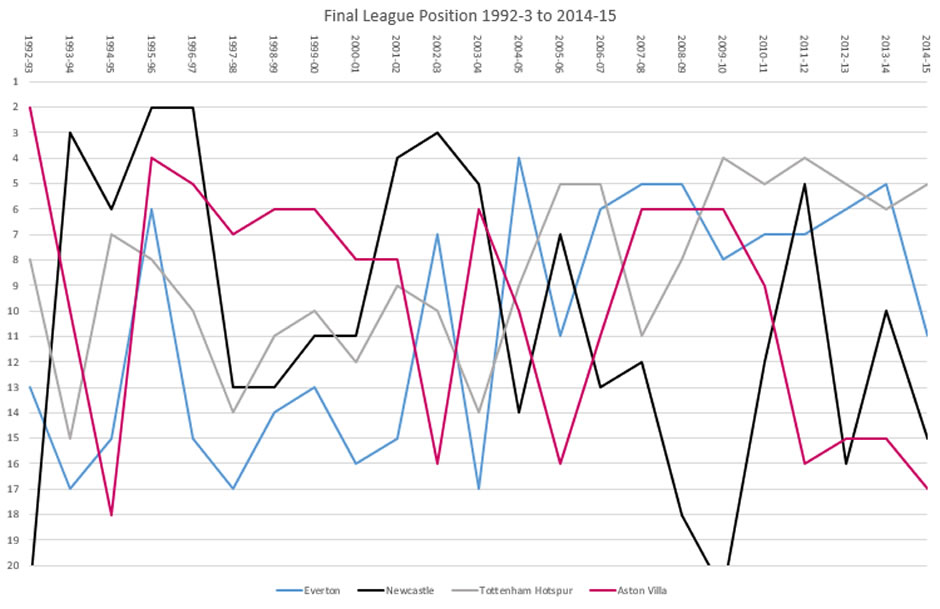
By comparable record what I mean is that all four clubs have been in the Premier League for all, or almost all, the period for which the league has existed, i.e since 1992/3. Aston Villa, Everton and Spurs have never dropped out of the top flight during that period, although Villa and Everton have been close to relegation a couple of time, while Newcastle missed the very first Premier League season in 1992-3 but were promoted that year as champions of what was then the Football League’s First Division and they’ve have also been relegated once but were promoted back up to the Premier League after one season in the Championship, again as champions. These clubs are also pretty similar in terms of their average finishing positions over time; Spurs is eighth, Aston Villa’s is ninth while Everton and Newcastle both have an average finishing position of tenth place.
What I personally take from this graph is that based on their recent performance over the last five to seven years, both Spurs and Everton can justifiable be considered mid-tier clubs, they’ve not quite made it up to the very top echelon, even though Spurs have managed to qualify for the Champion’s League a couple of times, even if on one of those occasions they were unceremoniously booted down to the Europa League so Chelsea, who finished outside the top four but won the Champion’s League, could defend their European title the next season. Villa were a mid-tier team up until four or five years ago, but have since dropped off a bit of a cliff and are now firmly in amongst the team for whom just staying up at the end of the season is a success and Newcastle are… well, nothing if not inconsistent but for me two good seasons out of the last ten interspersed with a relegation and some average to very mediocre finishes is not the stuff of even a mid-tier club, let alone a big one.
There is only so far I think a club can go in its appeal outside its core fan base on the back of archive footage of Kevin Keegan and Alan Shearer and that doesn’t for extend as far as getting between seven and twelve more live games – and the payments that go with that – than more than half the other teams in the same league.
A similar observation can, I think, be made in regards to this next graph, which looks just at Newcastle’s league position over the course of this season compared to that of three other teams who also had pretty decent starts to their respective seasons; Southampton, Swansea City and West Ham.
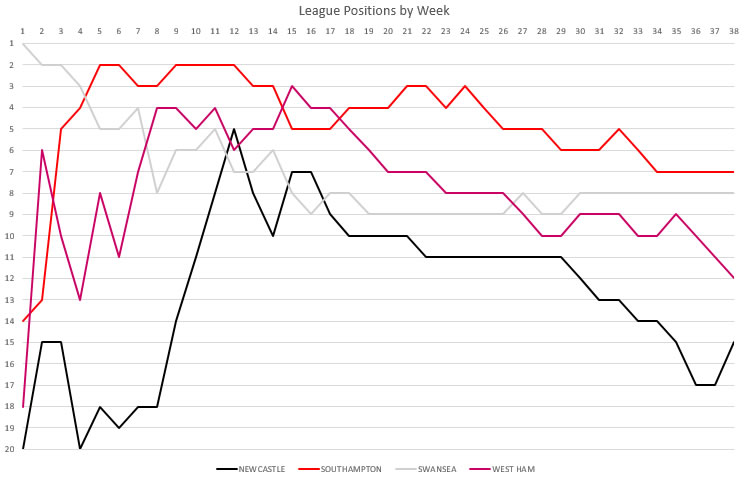
Remember Newcastle were allocated 20 live games over the season, seven more than either West Ham or Southampton and eight more than Swansea and in cash terms that made quite a difference. Newcastle might have finished in fifteenth place after narrowly avoiding relegation on the last day and seeing a couple of other results go their way but in the final TV cash table they finished in 10th place, above West Ham (13th) and above Stoke, who finished the season in 9th but got the minimum payment but only featured in nine live games and Crystal Palace, who finished tenth but at least got one extra facility fee payment over the minimum from 11 live games. Swansea ultimately finished in eighth place, good enough to net them the ninth highest TV rights payment overall, but still behind Everton who finished three places lower in the league but still picked up more cash thanks to an extra £3.8 million from the seventeen live games compared to Swansea’s twelve.
Can that really be justified?
In Everton’s case, perhaps given their performance over the previous few years, but in the case of Newcastle I’m not so sure, especially as along the way I managed to pick up a spreadsheet with a list of not only all the live games for the previous 2013-14 season but also the viewing figures for each of those games.
Now that spreadsheet, which I’m still working on analysing, throws up a few interesting additional pieces of information to add to the pot.
Some of this is only what you’d expect. In 2013-14, the five teams that were featured most often in live games on Sky and BT Sport were Manchester United, Liverpool, Chelsea, Arsenal and Manchester City and these were also the five teams that delivered the highest average viewings per game. Four of those teams were featured in 25 live games across that season, the only exception being Liverpool whose games were shown live on 28 occasions – and okay, they did have a very good season.
Where things get more interesting is when you come down to the next tier, where Spurs featured in live games 24 times, six more than during the season that’s just finished, Everton in 16 live games, one down on this year’s tally but Newcastle were only featured in 14 live games, two fewer than Aston Villa who, like Everton, featured in 16 live games and only one more than both Swansea and Sunderland, who were shown live on 13 occasions.
Meanwhile, at the bottom end of the scale, the teams that got their minimum 10 game payment without featuring in 10 live games included all the promoted teams, Cardiff, Norwich and Hull City, with 8, 9 and 9 live games respectively, plus West Brom (9), Fulham, who were eventually relegated (8) and Stoke City, who appear in just seven live games during the entire course of the season, with Crystal Palace and Southampton as the two teams who were paid for 10 live games and then appeared in 10 live games.
The interesting thing in all that is that in 2013/14 Southampton and Stoke finished directly above Newcastle (10th) in eighth and ninth places and both saw a modest increase in their number of live games this season but nothing like on the scale that Newcastle received.
And its also perhaps a little odd to reflect on the fact that Spurs lost six live games this season, despite returning the sixth best average viewing figures overall in 2013/14, while Newcastle gained six live games despite generating the fourth worst average viewing figures, although to be scrupulously fair there are a lot of factors that could easily have into play there that are outside the control of the clubs, from the timing of games and which network they appeared on – Sky has a larger subscriber base than BT Sport – to the opponents. The biggest draws are the big five clubs, so the more of your games against those clubs make it onto the live TV schedules, the higher your viewing figures are likely to be.
And from season to season there is also an element of the luck of the draw that will come into play. I’ve no doubt, for example, that when the annual fixture list is published, the smaller clubs in the league, and especially the newly promoted clubs, will look at that schedule and the dates of their games against the big five and think that’s where they’re likely to have the best chance of appearing live on TV. It doesn’t always work out that way, of course; the visit to Old Trafford could well be scheduled for the middle of the week, when there’s only one televised live game and on that same night two of other four members of the big five are due to play each other making that the first pick game for the evening. Meanwhile, your home game against Chelsea could fall on the same weekend as not only a game between two of the big five but also the Merseyside and Tyne-Wear derbies, knocking your game down to, at best, fourth choice, if there are four or more televised games scheduled for that weekend.
So, from season to season and even within seasons there are a lot of variables involved in the scheduling of live TV games, too many perhaps to pin down a definite pattern much beyond the fact that the big five clubs invariably get the lion’s share of both the live games and facility fees although developing a reputation for dull and rather boring football, as Stoke certainly have had for quite a long time and as Aston Villa gained under Paul Lambert, seems to the be the kiss of death when it comes to getting your games on live TV.
Still, there are anomalies in all this is deserve to be poked.
On top of the one’s I’ve already picked out it’s interesting, for example, the number of live games per club for this season is somewhat more closely correlated to the size of each club’s wage bill for the 2013/14 (based on figures from Deloitte) than it is the final league position of each club (0.86 against 0.75) and much more closely correlated to both than the correlation between wage bills and final league position (0.58).
And then, as a final observation, there appears to be the possibility – and it only a possibility – that the broadcasters’ decisions on which games to show live on TV could be being influenced to a degree by commercial considerations outside of those that are directly connected to the games themselves, i.e. subscriber and viewing figures.
This brings us back to the two teams that, this season, have seen the biggest shifts in their total number of live TV games, Spurs, which lost six live games compared to 2013/14, and Newcastle, who gained six – and that’s a difference in income from facility fees for each club of close to £4.5 million compared to 2013/14.
It also means pulling another table out my box of tricks, this one listing each of the 20 Premier League club with their main shirt sponsor for 2014/15 and the business sector that sponsor operates in.
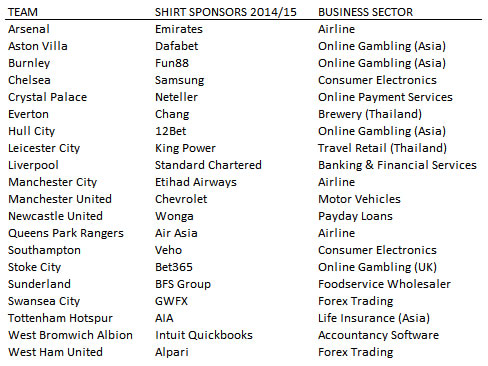
A couple of things stand out immediately, one of which is the global reach of the Premier League and the significant number of sponsors that clubs have been able to attract from the Middle East and Asia.
The second thing that’s obvious is that, within that list of shirt sponsors there very few mainstream consumer brands that will mean much, if anything, to a domestic audience. It wasn’t that way a few years ago; back in the 1990s and for most of the 2000s the shirts of Premier League clubs were awash with well known brands like Carlsberg (Liverpool), JVC and O2 (Arsenal), Reebok (Bolton Wanderers), Peugeot and Subaru (Coventry City). Strongbow (Leeds United), Walkers (Leicester City), Sharp and Vodaphone (Manchester United), Thomas Cook (Manchester City), Holsten and Thomson Holidays (Spurs).
There was even a mildly humorous element to some of the shirt sponsorship deals entered into by top flight clubs; for six years Newcastle’s shirts proudly promoted their city’s best known and most popular export, Newcastle Brown Ale, while the lingering reputation of West Ham’s notorious Inter City Firm was somewhat ironically reflected in the five years that the club was sponsored by Dr Martens.
Last season, by way of a complete contrast, there were probably no more than four clubs – Arsenal, Chelsea, Newcastle and Stoke – that were sporting sponsors logos that would mean very much at all to the majority of fans. Yes, most fans will be aware of the Etihad name and its association with the Middle-Eastern owners of Manchester City but how many will know that its specifically an airline, like the much more high profile Emirates brand, is open to question.
As for the rest, who knows for sure?
Chang have sponsored Everton for long enough for some to get the idea that its the name of a beer, but how many will know that the brand is owned by Thailand’s biggest brewer?
How many people do you think are under the impression that Leicester’s main sponsor, King Power, is an electricity company? It’s actually Thailand’s biggest travel retailer not that’s obvious from the name.
Manchester United’s latest sponsors, Chevrolet, are probably better known that their immediate predecessors, Aon, but in many cases more for the fact that one was driven to the levee in the song “American Pie” than for any of its current range of cars*, although avid Top Gear watchers may recall that the company was responsible for the Lacetti, which was the second of the show’s four “reasonably priced” cars.
*Yes, car nerds, I know… the Corvette and the Camaro… nice cars but not worth spoiling the American Pie gag for.
So what about Spurs and Newcastle?
Work with me on this, folks. In 2013/14, Spurs had a rather unusual shirt sponsorship deal under which it’s current sponsors, AIA – which is a large Pan-Asian insurance company that will mean nothing to UK consumers – were featured during cup game but when playing Premier League games the club’s shirts were sponsored by Hewlett Packard, a pretty well known producer and supplier of IT equipment, particularly laptops and printers, and a company that appears to spend a fair wedge each year on consumer advertising in the UK, including television adverting.
For 2014/15, however, the club’s sole shirt sponsor was AIA and the club lost six live games compared to the previous year.
Newcastle, on the other hand, have been sponsored by the payday loan company Wonga, which spends shitloads on TV advertising on both terrestrial and cable and satellite TV channels, many of which are either owned by or distributed via Sky – and the club gained six extra live games compared to last season even though everything from their performances last season and their recent track record to the viewing figures they were generating in 2013/14 tends to suggest that there’s really very little justify that increase when compared to clubs like Southampton and Swansea, which have been more successful in the last couple and have provided rather more entertaining.
If this just a coincidence or merely the luck of the draw when it comes to the fixtures schedule or might is suggest that the broadcasters may sometimes be influenced in their choice of game by other commercial consideration, such as whether a club’s main sponsor is in the business of also spending some of their money on TV advertising?
Who knows for sure?
It’s a question that cropped up while I was running the figures for this piece just because the shift in the number of live games that featuring Spurs and Newcastle in 2014/15 just looks a bit odd compared to the other clubs in the league.
That said, Newcastle are not the only club with a reasonably well known main shirt sponsor that’s also at a semi-regular TV advertiser, but of the other three clubs in that position two are Arsenal and Chelsea, both of whom are pretty much guaranteed around 25 live games a season under the current deal just because that seems to be the benchmark figure for the big five clubs, all of which leaves us with Stoke and their sponsor, Bet365, which certainly does advertise on television but – perhaps crucially – in direct competition with Sky’s own online gambling operation.
What does seem clear for all this is that while the Premier League’s system for distributing its TV and commercial revenues to the club may be the most equitable of any of Europe’s major, it doesn’t automatically follow that the fans of many, if not most, Premier League clubs will see that system as being one that fair especially, in the case of the 2014/15 season, if you’re a fan of a club like Southampton, Swansea or even Stoke, all of whom might reasonable feel that their club deserved better when it came to be selected for live games on the strength of their performances over the season.
The “Greater Newcastle as conurbation with only one premiership team” discussion seems a bit weird here. Sunderland exists.
Hmm, not sure about the advertising theory here.
One thing you hint at but don’t mention explicitly; the season’s televised games are not decided upon in full once the fixture list is generated. Sky and BT Sport know that they have a certain number of slots for games, but only decide the actual games to show about (roughly) 2 months in advance. This means that they can select games throughout the season according to where the stories are or might be. As an example (and going from memory only), Southampton had a blinding start to the season after getting promoted, and had more games televised in the second 2 month ‘chunk’ than you might otherwise expect for a newly promoted team. A similar thing happened to Swansea. Being a Liverpool fan, once our run began in earnest last season, around February, nearly all of our remaining fixtures were televised (the 3-3 at Palace was moved to a mid-week fixture for no other readily discernible reason).
Newcastle are definitely good for a story. The club is almost guaranteed to generate acres of column space for almost any conceivable reason in any season. So they get on the telly a fair bit. Clubs in the relegation battle get televised far more in final chunk of the season. I think that this season Chelsea’s early fixtures were generally inspiring, so they didn’t get shown. I’m willing to bet that significantly more Manchester United games were shown once it became apparent that the Moyes reign was going badly wrong. You can make pretty reasonable predictions about the Match Of The Day running order as well, so this is not confined to the commercial channels.